
Growth of U.S. LNG exports now expected to support 555,000 jobs annually and add $1.4 trillion to GDP through 2040 while domestic natural gas prices will remain among lowest in the world
WASHINGTON, July 16, 2026 /PRNewswire/ — Growing exports of U.S. liquefied natural gas (LNG) are now on track to support 550,000 jobs annually and contribute $1.4 trillion to U.S. gross domestic product through 2040–exceeding previous expectations–while having a negligible impact on domestic gas prices, according to a comprehensive new study by S&P Global Energy.
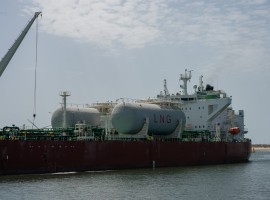
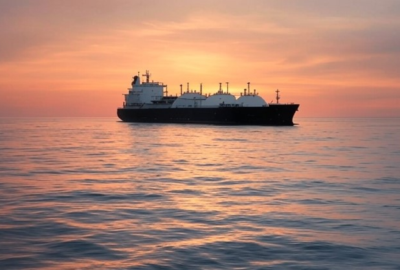
The new study projects that, under current conditions, U.S. feedgas demand for LNG exports will double to 36 billion cubic feet per day (bcf/d) in the next five years, 25% higher than previous base case projections. The United States, already the world’s leading supplier of LNG, is expected to surpass a one-third share of the global market during this time, almost certainly making LNG exports the second largest net export industry in the United States, second only to U.S. civilian aircraft and parts.
Get the Latest US Focused Energy News Delivered to You! It’s FREE:
The study, updates the findings of a December 2024 to account for a surge in LNG investment that has occurred since the lifting of the U.S. LNG ‘pause’ in January 2025, with seven new projects taking final investment decision and several more expected in the next 6-12 months.
S&P Global Energy now estimates that total investment in the LNG supply chain will exceed $1 trillion through 2040. In addition to the increased jobs and GDP gains, the new study expects future LNG export activity to generate more than $2.9 trillion in total revenues for U.S. businesses, $206 billion in federal and state tax revenues and nearly $630 billion in labor income.
The economic impacts extend far beyond gas-producing states, with 42% of jobs and 33% of GDP contributions occurring in non-gas-producing areas.
“The profound growth of U.S. LNG is exceeding all expectations,” said Daniel Yergin, Vice Chairman, S&P Global and study chair. “What has become a $44 billion annual industry in just the last decade is now poised to be the country’s second largest net export within five years.
“The economic gains in terms of jobs, GDP and labor income are on track to surpass all prior expectations, while the abundance of U.S. gas resources means that domestic prices remain among the lowest in the world. The economic benefits and low domestic prices, along with significant contributions to global energy security and the influence that comes from being the world’s largest supplier add up to the benefit of the United States.”
Impact on Domestic Prices Negligible
Notably, the economic benefits occur while the impact on U.S. domestic natural gas prices is negligible. The study projects an average increase in end user gas costs of just 1.6% per household from 2026 to 2031. United States domestic natural gas prices will continue to rank among the lowest in the world for both residential and industrial sectors.
“More than 45 years of identified commercial gas resource in the United States at today’s production levels and the world’s most interconnected pipeline network are what enable both exports and low domestic prices,” said Eric Eyberg, Vice President, Gas and LNG, S&P Global Energy. “Since 2010, domestic prices have trended downward even as demand for U.S. gas has grown 70 percent. The recent Iran conflict has proven the U.S. domestic gas market resilient to external shocks relative to global gas and other commodities. U.S. Henry Hub gas prices declined during the conflict.”
Additionally, flexible U.S. LNG has turned export capacity into a domestic gas price shock absorber, the study says. During Winter Storm Fern, up to 9 bcf/d of feedgas was redirected for domestic consumption, providing critical supply for residential markets amid surging winter heating demand.
Major Implications for Global Gas Prices and Energy Security
The study also considered the implications of any curtailment of export volumes from U.S. LNG projects sanctioned post-U.S. LNG ‘pause’.
Under an “Extended Pause” scenario where the new investment since 2025 in U.S. export capacity was not realized, global LNG markets would tighten significantly by 2031, pushing prices 50% higher for Europe and Asia and effectively transferring up to $76 billion per year to non-U.S. energy suppliers that would step in to fill demand, mostly with other fossil fuels, including coal, the study says.
As the United States is currently the number one supplier of LNG to Europe, the largest beneficiary of any curtailment of U.S. flows would be Russia, the study says. Due to current sanctions, Russia has up to 14 bcf/d of underutilized gas pipeline and LNG export infrastructure – connected with and proximate to Europe – that could quickly increase flows to meet regional needs.
The Role of Infrastructure in Domestic Price Relief
The shale gas revolution and abundance of the U.S. natural gas resource base have shifted the domestic market dynamic to a new paradigm where infrastructure constraints are often the key driver of higher-priced regional markets and price volatility, the study says.
The United States has the world’s most interconnected gas infrastructure network, with more than 300,000 miles of natural gas transmission pipelines. The annual volume of natural gas transported through the system exceeds the combined consumption of 130 countries. Nevertheless, key bottlenecks remain.
The study examines the potential impact of expanded pipeline capacity in the U.S. Northeast, where winter heating and growing winter power loads have led to highly seasonal demand and extreme price volatility.
New capacity additions could reduce peak winter month gas prices by more than 20% in key New England and New York markets during the 2028-2031 period, the study finds.
“The United States is in the enviable position where supply and demand are not a major issue,” Eyberg said. “Since 2010, domestic gas production has been able to grow three times the amount of U.S. LNG exports. Infrastructure constraints and imbalances are what drive higher regional prices and volatility. The ability to build pipelines is the main challenge.”
U.S. LNG Exports Today
- $44 billion in 2025 exports
- 2.3 times the value of U.S. corn exports
- 2.8 times the value of U.S. soybean exports
- Nearly triple the exports value of U.S. movie and TV related revenues
- 70% the value of U.S. semiconductor exports
- More than 80% of the total value of U.S. passenger cars exports.
U.S. LNG Exports – Base Case Economic Impacts Through 2040
(Change from December 2024 Projections)
- 555,000 annual jobs supported through 2040 (+55,000 jobs annually)
- $1.4 trillion contribution to U.S. gross domestic product (+$100 billion)
- $2.9 trillion total business revenues through 2040 (+$400 billion)
- $206 billion in U.S. federal and state taxes (+$40 billion)
- $630 billion in labor income (+$130 billion)
- Projected second largest U.S. net export industry by 2031
About the Study:
Price and Economic Impacts of an Accelerating Export Industry is available at:
This study offers an independent and objective assessment of the economic, market and global impact of the U.S. LNG Industry built from a detailed bottom-up approach, at the asset and market level, technology by technology. It is produced by S&P Global CERA Consulting and represents the collaboration of S&P Global Energy and S&P Global Market Intelligence, supported by the world’s largest expert team of more than 1,400 energy and economic research analysts and consultants continuously monitoring, modelling and evaluating markets and assets. The analysis and metrics developed during the course of this research represent the independent analysis and views of S&P Global Energy. The study makes no policy recommendations. This research was supported by the U.S. Chamber of Commerce.
S&P Global Energy is exclusively responsible for all of the analysis, content and conclusions of the study.
About S&P Global Energy
At S&P Global Energy, our comprehensive view of global energy and commodities markets enables our customers to make superior decisions and create long-term, sustainable value. Our four core capabilities are: Platts for pricing and news; CERA for research and advisory; Horizons for energy expansion and sustainability solutions; and Events for industry collaboration.
S&P Global Energy is a division of S&P Global (NYSE: SPGI). S&P Global enables businesses, governments, and individuals with trusted data, expertise, and technology to make decisions with conviction. We are Advancing Essential Intelligence through world-leading benchmarks, data, and insights that customers need in order to plan confidently, act decisively, and thrive in a rapidly changing global landscape. Learn more at .
Media Contacts:
Jeff Marn
S&P Global Energy
+1 202 463 8213
SOURCE S&P Global Energy
Share This:
More News Articles