In 2023, Virginia emerged as the top net electricity recipient among all U.S. states. Across the Lower 48 states, nearly 10% of electricity generated is routinely traded across state lines. While 25 states produce more electricity than they consume, the excess is transmitted to other states. Virginia’s utilities received a net 50.1 million megawatt-hours (MWh) of electricity from other states, making up 36% of its total electricity supply. Pennsylvania, on the other hand, led in exporting electricity, moving 83.4 million MWh across state borders, accounting for 26% of its total generation.
The management of electricity systems is handled by balancing authorities rather than individual states. These authorities operate across state lines to ensure resources are dispatched to meet demand while maintaining a balance between generation and consumption.
Data on interstate and international electricity trade was recently published in the State Electricity Profiles. The trade is calculated by subtracting retail electricity sales, direct use, international exports, and estimated line losses from the electricity generated within a state. Pennsylvania, Alabama, and Illinois consistently generate more electricity than they consume. For over a decade, these states have leveraged high-capacity nuclear and natural gas plants, which together contribute over 70% of their electricity generation.
Shifts in fuel use have transformed the electricity mix in these states. Twenty years ago, coal dominated generation in Pennsylvania and Alabama, but natural gas now leads, followed by nuclear. In Illinois, where coal and nuclear power once generated equal shares of electricity, 55% of the generation now comes from nuclear plants, with natural gas, coal, and wind making up the rest in near-equal proportions.

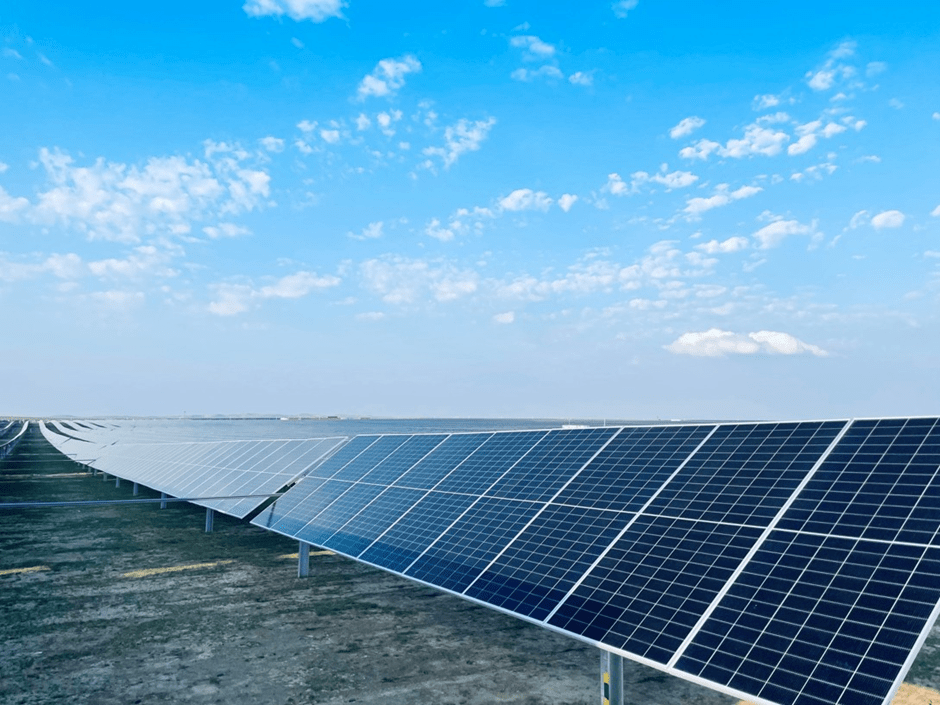
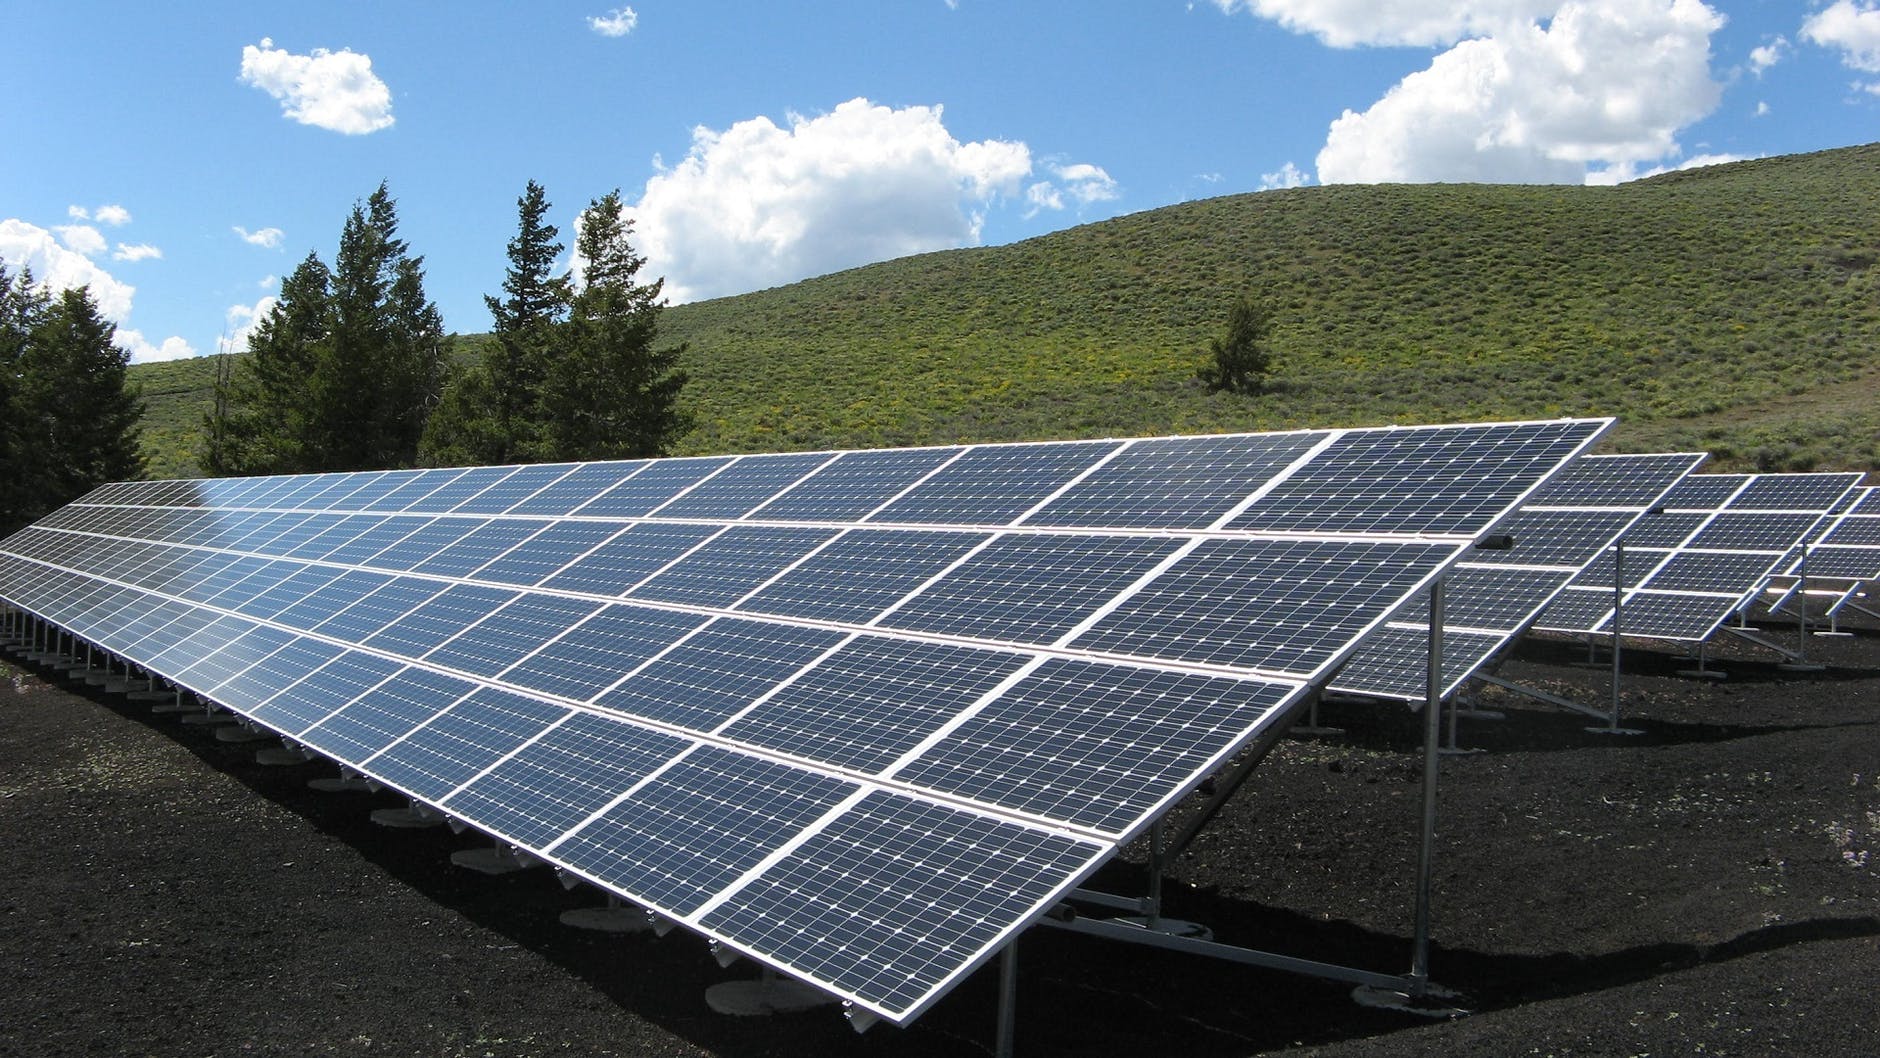
California and Virginia have long consumed more electricity than they produce. While generation has increased in both states, Virginia’s interstate electricity receipts have grown significantly over the past five years, rising by 61% (19.0 million MWh) from 2019 to 2023. In contrast, California’s receipts decreased by 39% (27.8 million MWh) during the same period. This decline in California is largely due to increased rooftop and net-metered solar installations and energy efficiency programs. California leads the nation in rooftop solar capacity, which stands at 16.6 gigawatts (GW), surpassing the utility-scale solar farm capacity of 15.0 GW in Texas.
In 2023, Virginia surpassed California as the largest recipient of electricity from other states. California’s electricity receipts fell by 28.3 million MWh, driven by a 5% (12.4 million MWh) drop in consumption and an 84% (14.7 million MWh) increase in hydroelectric generation compared to 2022.
The Pacific Northwest experienced a significant shift in electricity trade. In Washington, utilities went from producing a surplus to importing 1.1 million MWh in 2023. This represented a 25.1 million MWh turnaround due to reduced hydroelectric generation caused by drought conditions in Canada and Washington. Electricity generation in Washington fell by 22% (17.5 million MWh) compared to the previous year.


